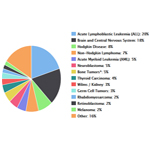
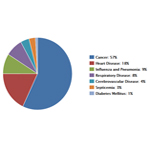
5 year survival rates for the cancers that have the highest unmet need and that we are/have funded research within. This can be used to compare to the average 5-year survival rates to show that while it has improved overall, there are still areas where more research is needed.
Source: www.cancer.org/cancer/types/neuroblastoma/detection-diagnosis-staging/survival-rates.html
Source: www.cancer.org/cancer/types/osteosarcoma/detection-diagnosis-staging/survival-rates.html
Source: www.cancer.org/cancer/types/ewing-tumor/detection-diagnosis-staging/survival-rates.html
Source: www.cancer.org/cancer/types/rhabdomyosarcoma/detection-diagnosis-staging/staging-survival-rates.html
Sources: dipg.org/facts/dipg-survival-rate-and-prognosis and www.abta.org/tumor_types/pediatric-high-grade-gliomas-hgg
Source: together.stjude.org/en-us/about-pediatric-cancer/types/brain-spinal-tumors/medulloblastoma.html
Source: nccrexplorer.ccdi.cancer.gov/application.html and www.cancer.gov/types/leukemia/hp/child-aml-treatment-pdq
Source: nccrexplorer.ccdi.cancer.gov/application.html and my.clevelandclinic.org/health/diseases/24440-rhabdoid-tumor
Source: onlinelibrary.wiley.com/doi/full/10.1002/pbc.28138
Where applicable: NCCR*Explorer: An interactive website for NCCR cancer statistics [Internet]. National Cancer Institute; 2023 Sep 7. [updated: 2023 Sep 8; cited 2024 Aug 28]. Available from: nccrexplorer.ccdi.cancer.gov.
View our other childhood cancer statistics charts and graphics:

 Cancer Incidence
 Cancer Deaths
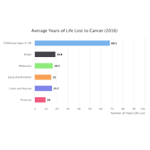
 Average Years of Life Lost to Cancer
 Infographics